Causal Profiling Rust Code
There’s a new hotness in performance measurements, and it’s called causal profiling. The idea behind it is that you want to measure how a speed up of a certain function would impact the runtime as a whole, which can be very counterintuitive in today’s multi-threaded world.
The congenial trick to make this possible is to simulate speeding up one portion of the code by slowing down everything else running concurrently and subtracting the time added by the slowdown from the total.
This is all very understandably explained in a youtube video of a talk by one of the researchers who created the tool for this. Their paper (PDF) has more details.
The causal profiler is called coz and is written for C programs. However, the unstoppable Alex Crichton has taken it upon himself to port the runtime component to Rust, so we can use it to profile Rust code.
(Aside: I added some code so we can have a scope! macro that will add begin
and end tracepoints for the current scope regardless of possible early exits.
This is something that C cannot do, so yay for Rust!)
Now how do we actually run it? First, we have to install coz. On my system,
this required installing the python3-docutils package (for the manpage) and
the libelfin library for reading the DWARF information, which coz uses to
identify the line of code it traces. With that out of the way, make && make
install worked beautifully and I could start on my merry way.
Alex’ coz-rs has an example, so this was the first I tried to profile:
coz-rs$ cargo build --release --example toy
coz-rs$ coz run --- target/release/examples/toy
The latter went through a whole lot of output and then saved a profile.coz
that I could plot with a web-based viewer (you can browse to
file:///your/path/to/coz/viewer/index.htm, use a provided version hosted on
github or set up your own local webserver). The output looks pretty neat:
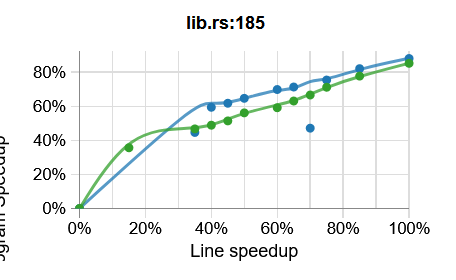
This graph plots the program speedup under the assumption that the code at a given point would be sped up by a certain amount with 100% being the complete removal of the runtime for this range of code.
Let’s look at a slightly more taxing example. The regex-redux benchmark has
a number of operations, some of which run in parallel (via rayon). This seems
a good one for coz, so I instrumented the code for latency profiling.
The first problem I ran into was that coz did not pipe through stdin to the benchmarked executable, so I had to change the benchmark to hardcode a file with the input text.
Next up, coz exited with an error code of 245. Looking for clues, I found that
I had missed coz::thread_init(). But even adding that did not help. So I
randomly commented out code sections and found that the part where we find the
replaced sequence length and count matches in parallel (using rayon to join the
threads) caused the error.
However, somewhat surprisingly, removing the threads and running the code on the main thread did not solve the issue. Looking at the coz repo, I found someone had submitted an issue with a different benchmark where it appeared that jemalloc was the culprit, so I tried using the system alloc:
use std::alloc::System;

#[global_allocator]
static S: System = System;
However, even that did not help. Running the program without coz worked fine, but I couldn’t get it to run with coz. So I’ll leave the conclusion to a future post. Stay tuned!